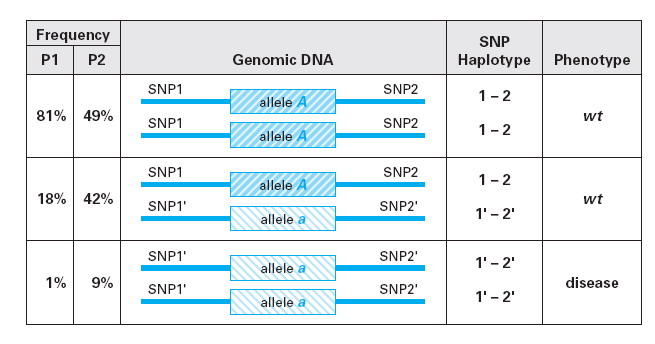
Figure 3.6 Comparison of SNP data for two populations


发布日期:2006-04-15 来源:- 作者:655 x 344 像素 浏览次数:
132
核心提示:Two
populations (P1 and P2)
have different frequencies
of a single-locus disease.
Included in this figure are
diagrams of the genomic
DNA showing two SNPs
(1' and 2') and a recessive
allele (a) that are in linkage
disequilibrium. In this fig