VIP标识 上网做生意,首选VIP会员| 设为首页| 加入桌面| | 手机版| 无图版| RSS订阅
 
当前位置: 首页 » 食品图库 » 食品检测技术 » 分子生物学 » 正文

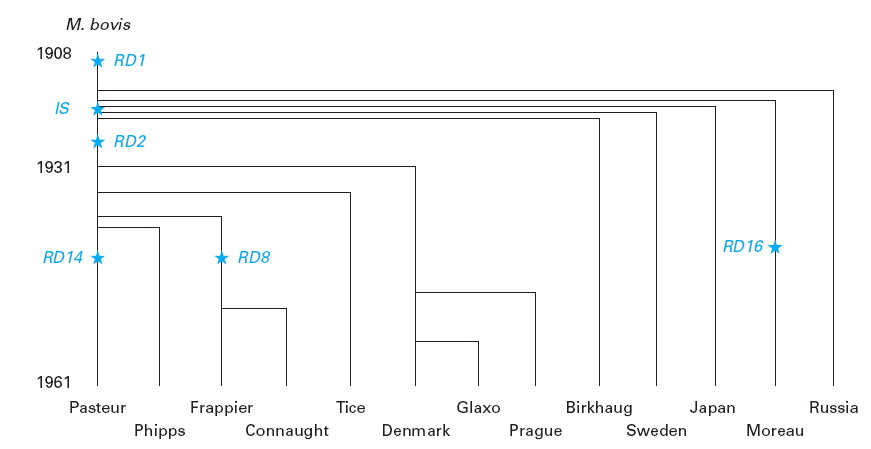
Figure 5.14 BCG genealogy deduced from microarray-detected d

放大字体  缩小字体 发布日期:2006-04-15  来源:-  作者:871 x 449 像素  浏览次数:187
核心提示:The vertical axis represents time, and the horizontal axis distrib- utes different geographical locations of the strains used in this study. Six deletions are marked by the blue stars on branches of the dendrogram.
Figure 5.13 BCG genealogy deduced from microarray-detected deletions in the 16 currently available strains
 
[ 网刊订阅 ]  [ 食品图库搜索 ]  [ ]  [ 告诉好友 ]  [ 打印本文 ]  [ 关闭窗口 ] [ 返回顶部 ]


推荐图文
推荐食品图库
点击排行
 
 
Processed in 0.100 second(s), 18 queries, Memory 0.92 M