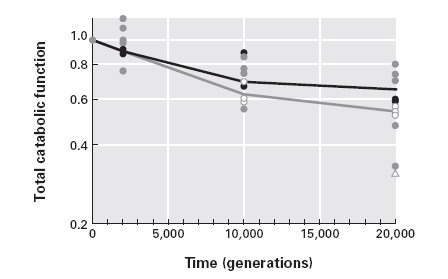
Figure 3.13 Evolution of total catabolic potential during 20


发布日期:2006-04-15 来源:- 作者:448 x 279 像素 浏览次数:
109
核心提示:Total relative catabolic function is
calculated as a weighted average for growth on 64 different
substrates, with 1.0 representing the starting point of catabolic
potential. Values are shown on a logarithmic scale so a muta-
tion accumulation out