Figure 3.12Changes in fitness for E. coli during an evolutio


发布日期:2006-04-15 来源:- 作者:860 x 323 像素 浏览次数:
139
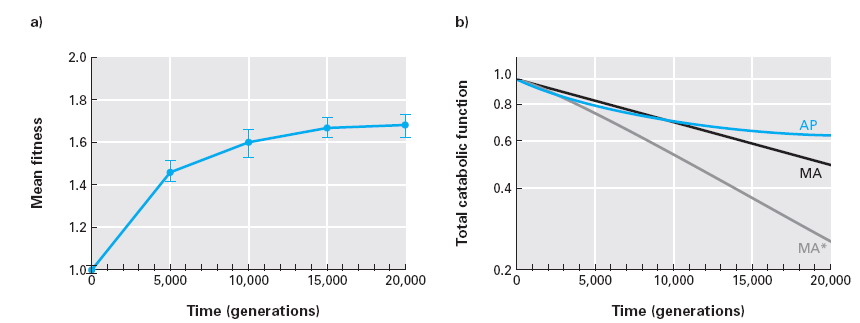
核心提示:a) Measurement of mean fitness during 20,000 generations in minimal glucose medium. Each
point is the mean of all 12 populations, with each population tested five times. Error bars are
the 95% confidence intervals, and Y-axis is a linear scale. b)