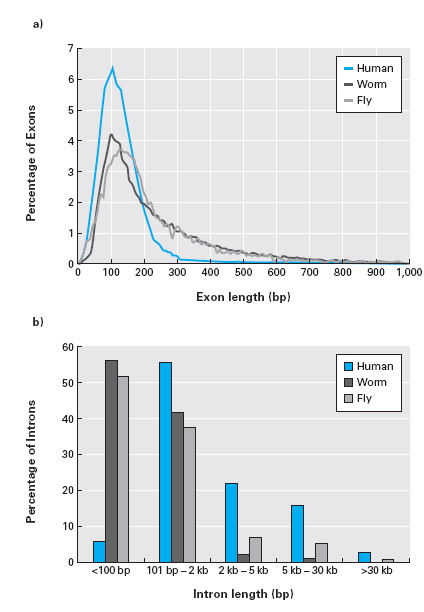
Figure 1.6 Size distribution of exons and introns.


发布日期:2006-04-15 来源:- 作者:424 x 612 像素
核心提示:a) Species comparison of exons
sizes in human, C. elegans, and Drosophila
genomes. b) Species comparison of intron sizes
in human, C. elegans, and Drosophila genomes.
Note the inverse correlation between intron and
exon sizes.